
Link to dashboard: Chum Returns to the Lower Fraser Valley
Client: VIVA Capstone Project
My role: Data visualization, UI design, data wrangling
Tools: Tableau, Python, OpenRefine, Excel
Summary
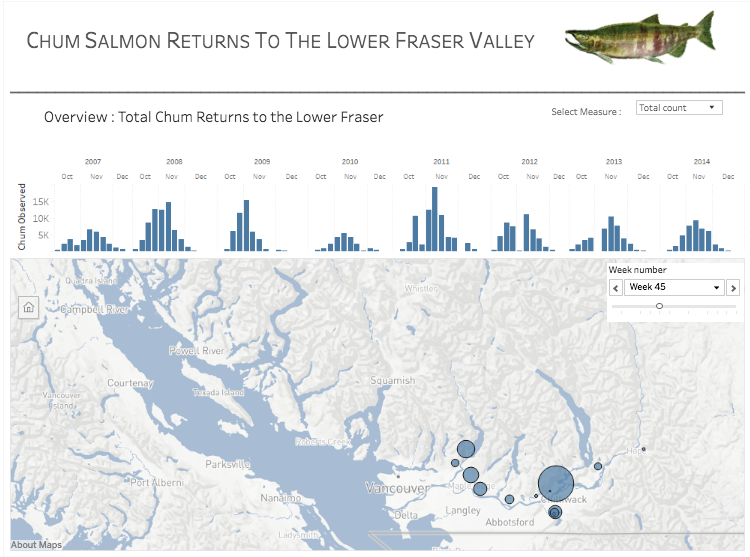
This dashboard displays information about the timing and abundance of chum salmon during their fall migration into rivers near Vancouver, British Columbia. Users can see which streams salmon are migrating into, how many are there on average during the fall season, and how their populations change throughout the fall.
Background
I built this Tableau dashboard in fall of 2017 for VIVA’s Student Workshop Series with my friend Spence Duncan. He and I are fly fishing partners and spend a fair amount of time fishing salmon in the fall. Salmon are anadromous fish, meaning that they are born in freshwater, migrate out to sea to live their adult lives, and then return to freshwater to spawn and die. Fly fishing for salmon is at its best in that narrow window of time in the fall when salmon have returned to freshwater as adults, but have not yet begun spawning. Targeting fish at the beginning of their return is most productive as the fish are healthier and more likely to bite at a fly. Targeting fish late in their lifecycle can put unnecessary pressure on them while they are attempting to spawn, and walking in the river at this time can damage nests and eggs. This window is often only a week long, and because the exact timing of these returns varies depending on the stream, it can be difficult to know where to be and when to be there during the fall season. Knowing where salmon were throughout the season, how long they were in those streams, and how many of them were in each stream would allow us to better direct our fishing efforts.
The federal Department of Fisheries and Oceans is the government body that conducts research into salmon runs, and so we did a literature survey of their published work to find an appropriate data set. Spence found a paper entitled “Coho (Oncorhynchus kisutch) and Chum (O. keta) Salmon Visual Enumeration Surveys in Twenty-Six Lower Fraser Area Streams 1999-2005”, which documented chum salmon runs in a number of small creeks in the Fraser Valley. We contacted the lead author, and she graciously supplied a set of excel documents that contained the published data.
Data Management
The data consisted of fish counts during the falls of 1999 to 2005 at 26 creeks throughout the Fraser Valley. Variables were as follows: creek name, latitude, longitude, date, count. A separate excel document had been maintained for each creek. We wrote a python script to consolidate and transform the data into a single tabular csv file, which we then processed using OpenRefine to clean up inconsistencies in creek names and lat/long.
Design
As with all visualization design, we had to lay out what we wanted the visualization to help us accomplish before beginning to design it. Our overarching goal was to create an interface that would allow us to explore the data and pick up trends, patterns and outliers in these salmon runs. More specifically, we wanted to determine the following:
Task 1: Which creeks hold the most fish?
Task 2: How many fish are in each creek at any given time during the fall season?
Task 3: When do these runs peak (ie at what date do fish counts reach their maximum value for any given creek)?
Admittedly, these could be accomplished to varying degrees by sorting and filtering a database, but while this would allow you to look up these numbers, it would not enable the sort of exploration of the data that would give you a more complete understanding of how salmon runs vary throughout the Fraser Valley.
Conclusions
Designing this visualization gave me new insight into the patterns that spawning salmon exhibit in the Fraser Valley. For one, salmon runs in the Fraser valley both begin much earlier and end much later than I expected. Based on personal experience, I thought that chum in-migration mainly occurred during the first and second weeks of October. In fact, chum were present in some systems until late December. Chum survive in freshwater for less than two weeks, and thus these fish would not be mid-October holdovers, but late movers who came into the river system in mid-December at earliest. Generally speaking, salmon runs were more diverse than I expected, in both run timing and total run size. In my uninformed imagination, creeks generally got a couple thousand fish, and these arrived in mid October. Instead, runs varied from fewer than a hundred (ie Chilqua) to over ten thousand (ie Squawkum), and peaked anywhere from October (ie Kanaka) to December (ie Chilqua). Year to year variation was also interesting, in that run size was highly variable, but run timing was relatively consistent. For example, Squawkum consistently saw its highest returns in mid November, but the size of these returns varied from fewer than 4000 fish to nearly 15000.
Integrating a map view of the data also revealed some patterns in timing and distribution. From casual observation, it appears that spawning tends to peak in the western Fraser Valley earlier than it does in the east. Furthermore, the highest density of observations comes from the greater Chilliwack area. This could reflect either a) a greater density of salmon bearing streams in the region or b) a bias towards observing and reporting on these systems.